Azure Load Testing – First Impressions

On November 30 2021 Microsoft announced the public preview of the Azure Load Testing service, a successor to the deprecated Visual Studio Team Services/Azure DevOps Load Testing tool. I caught wind of this via Twitter while in the hotel bar that night with my European Cloud Summit session on Scaling Websites using Azure, so I did what any perfectly normal person masochist would and rolled the dice on building a demo that night.

All I needed to do was build a simple website, create the necessary Azure resources, deploy the code, build a JMeter script and then try the service. No problem.
For the website I decided to use the classic TODO app backed by Cosmos DB from the tutorial provided by Microsoft. But modified to use Managed Identity, because good practices are good.
In short order I had a working website deployed to Azure.
After loading a few TODOs into the app I built a simple JMeter script to load the list page and then a random detail page.
With a provisioned Load Testing service I was up and running with a working demo inside of a couple of hours.

Default view of the Azure Load Testing service

Creating a test run is easy:
Give your run a name, description, and choose if you want it to run after creation

Screen shot of load test run creation basics: 
Give your run a name, description, and choose if you want it to run after creation

Upload your JMeter script and optional configuration files:

Upload form for JMeter tests

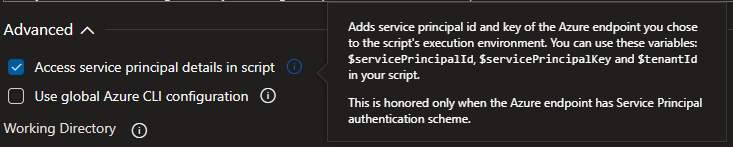
Set any environmental variables and secrets needed for the test run, in my case I didn’t need any

form to capture Environment Variables and Secrets


Choose how much load to apply, the help text here is really nice that it calls out that you tests should set the maximum number of thread to a maximum of 250. With the ability to use up to 45 engines this caps the current capacity at 458,250 threads. My bet is that’s going to be plenty for most organizations to to load testing.

Form slider input to set the number of test engine instances.

Next up you can configure test criteria. This is an area where I’d like to see some improvements. At present the only options are Average Response time and Percentage of errors. At an absolute minimum I feel like this should provide Percentile options for the response time so that a test can be failed on the 90th percentile of response time exceeding a threshold.
It’s worth noting that given this approach there’s no filtering to only measure the critical requests, so test tuning might need some careful attention when using these criteria as an acceptance measure.

Form to set test criteria via dropdowns and an text input.

Then you can select the Azure resources which should be monitored. The default here is to show all the resources in the subscription for selection but adding a resource group filter helps to narrow the search nicely. It might be nice to open this dialog with the resource filter pane open and awaiting input as this view might be slow to populate in subscriptions with a lot of resources to choose from.

Forms to select the Azure resources to be monitored
Monitoring pane with a number of resources to be monitored shown

Finally you can review the settings and create your test run

Review and create screen detailing selected options

After clicking create the test run moves through a number of states as the service does its work, starting with Accepted

Test run in Accepted state

The service then starts provisioning the necessary infrastructure to run the tests.

Test run in provisioning state

Applies the necessary configuration to the run the test.

Test run in configuring state

And then starts running the test in the Executing state

Test run underway in the Executing state

The tests finish and the run is Done.

Test run in the done state, shows some quick overview metrics.

Don’t be fooled though, the service now needs some time to aggregate the metrics from JMeter and the telemetry from the Azure resources which were being monitored. Here it might be nice to show some feedback that this work is happening as the current view looks, well, broken, because none of the graphs are populated. After a while the graphs are populated and you get a view like this:

Performance graphs for resources selected for monitoring

These graphs also contain a link to the App Service Diagnostics tool as I had added an App Service into the list of resources being monitored which is nice. Unfortunately the time filter applied when linking is a whole day rather than being a time range centered on the test run. Zooming to the data that is relevant here would be a smart move in my opinion.

Link to app service diagnostics

In the command bar at the top of the Test run report there are some useful tools

Command bar for a Test run
  • Rerun
    • Repeat this test run, with the same JMeter test but using any configuration changes applied to the test run, and of course any changes to the deployed code or Azure resources being monitored
  • Compare
    • Allows basic comparison between repeated runs of the same Test run. Yeah, that’s as confusing as it sounds, but I assume this is to ensure that the things being compared are reasonably similar as it is possible to have a new test run in the same service run a completely different JMeter test against another set of Azure resources.
  • App Components
    • Add or remove Azure resources being monitored during the test run, this is really handy as I definitely skipped past the step to set up the resources being monitored in the creation wizard
  • Configure metrics
    • Add or remove reporting metrices to show in the page, for example your might want to add a metric on Http Status 4xx
  • Download
    • Download the JMeter generated output, this is really useful to see more fine grained data on what the JMeter client observed during testing

So, about that demo during my session…
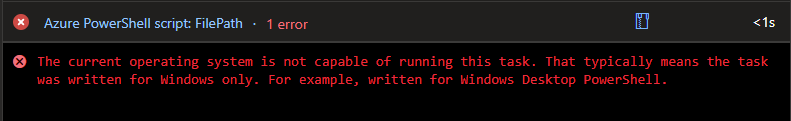
I knew I was taking a risk on this one, and the demo gods were cruel this time.
I was able to show my attendees the creation and set up of a test run, but unfortunately the service decided that it would not work for me and got stuck in the provisioning state for a few hours before failing 😦
Thankfully I was able to pivot an show the results from a test run done earlier while preparing the demo.

On the whole I think that this service shows a lot of potential, I’m looking forward to experimenting more with this tool and trying to integrate it into some CI/CD pipelines next week when I’m back in the office.

Posted in Azure, Deployment, DevOps | 3 Comments

Linux + PowerShell + AzureCLI in DevOps Pipelines

A couple of months ago I had an exchange with Donovan Brown on Twitter about using AzureCLI & PowerShell in Azure DevOps pipelines on Linux hosted agents. As is often the way I didn’t have the time to take the advice I received and experiment straight away. As we ramp into a new project I realized that I had project where trying this approach made sense.

So, I was eager to try this out and dived in, adding an Azure PowerShell task to my pipeline to try blending the lovely Json responses from Azure CLI with the power of proper objects in my scripts. So, attempt #1:

Let’s run some PowerShell in a Linux pipeline
Version 3 of the Azure PowerShell task is Windows only 😦

So, a quick change to toggle the task to use Task version 4 (aka Preview)

And, much after anticipation….. ERROR: Please run 'az login' to setup account. 😦 Much disappointment. But Donovan said he does it, so how does this work?
Taking a look at the logs for an Azure CLI task shows me some thing interesting.

[command]/usr/bin/az cloud set -n AzureCloud
[command]/usr/bin/az login --service-principal -u *** -p *** --tenant *** 
[
   {
     "cloudName": "AzureCloud",
     "id": "0ff1ce000-1d10-t500-86f4-28b59b7dbf13",
     "isDefault": true,
     "name": "Not really the name :P",
     "state": "Enabled",
     "tenantId": "***",
     "user": {
        "name": "***",
        "type": "servicePrincipal"
     }
   }
]

And then inspecting the task options I can see a way of accessing those variable in an Azure CLI task.

Ohhh this looks promising….

Couple this with some cunning use of the task.setvariable command and I can bubble these parameters out for use in the rest of my pipeline:

# Echo the authentication detail out to variables for use in a PowerShell step
echo "##vso[task.setVariable variable=servicePrincipalId]$servicePrincipalId"
echo "##vso[task.setVariable variable=servicePrincipalKey]$servicePrincipalKey"
echo "##vso[task.setVariable variable=tenantId]$tenantId" 

Which then get passed into PowerShell script as arguments, $(servicePrincipalId) $(servicePrincipalKey) $(tenantId) and used like so:

 az login --service-principal `
          -u $servicePrincipalId `
          -p $servicePrincipalKey `
          --tenant $tenantId 

Hey presto, Azure CLI calls from PowerShell on a Linux hosted build agent 😀
Hopefully someone out there will find this useful.

Posted in Azure, Deployment, Development, DevOps, PowerShell | 1 Comment

Using Azure DevOps to build your create-react-app packages

I’ve recently delved into the world of React and started using create-react-app, sometimes called CRA, to bootstrap up my project and build tool-chain. As you start to build more complex applications than HelloWorld or TODO.js sooner or later you’re going to want to separate some of your configuration from your code. This is incredibly good practice. For example your application might be dependent on a RESTful service, this service might have both production and test URLs. Now if you’re “doing it right”™ then you’ll have these URLs as configuration.

CRA has really good support for separating your code and config. This support is predicated around setting environment variables or using .env files to hold the configuration for a particular environment. I don’t want to have .env files in source control, even if those values that wind up in JavaScript will be out there in plain text for anyone to read. To facilitate this I make use of environment variables controlled by my build environment, in this case Azure DevOps.

For a simple example let’s run with idea of having our app depend on a service with test and production URLs. To accommodate this we might simply set up an environment variable and configure a simple http client to use it.

const customApi = axios.create({
    baseURL:process.env.REACT_APP_API_URL
});
export default customApi;

Now all that needs be done to build for test and production is to set the value of the REACT_APP_API_URL environment variable to match the desired target. In Azure DevOps any variables that you define for the build pipeline are exposed to your tasks as environment variable. Thus configuring a pipeline variable will allow you to build for your target environment.

But what about if you would like to build test and production package in a single pipeline? Now you’ll need to use a obscure little bit of wizardry specific to Azure DevOps to change the value of the REACT_APP_* environment variable by echoing it out inside a special block of text. It’s documented here:
https://docs.microsoft.com/en-us/azure/devops/pipelines/process/variables?view=vsts&tabs=yaml%2Cbatch#set-a-job-scoped-variable-from-a-script.

So, what I have done is configure a second pipeline variable:

Then in a script task use the magical echo to overwrite the value of REACT_APP_API_URL for the remainder of the pipeline execution

echo "##vso[task.setvariable variable=REACT_APP_API_URL]$(_prod_REACT_APP_API_URL)"

Now I can call build a second time in the same pipeline. Here’s the complete overview for my pipeline:

There you have it, a single build pipeline for a React application producing packages for both test and production environments.

Posted in Azure, Deployment, DevOps | Tagged , | Leave a comment

SPTechCon: Hit the ground running with the Microsoft Graph

I had the pleasure of presenting at SPTechCon in Boston today. It was a fun talk with a great audience.

As promised here is my Postman collection and slides:

Posted in Community, Conferences, Development, Microsoft Graph, Uncategorized | Leave a comment

Disabling TLS 1.0 on Windows 10

I’m setting up a new PC and as usual I’m installing PoshGit from Chocolatey. This time it failed trying to download the zip file. Turns out that GitHub has disabled TLS 1.0 connections which Windows 10 still ships with enabled.

The documentation on how to disable this this is reasonably good: https://docs.microsoft.com/en-us/windows-server/security/tls/tls-registry-settings#tls-10

It is a small edit to the registry, just create the keys to denote if you’re disabling the Client or Server TLS 1.0 protocol, or use the DisabledByDefault option for a little flexiblity, which is what I used.

Frankly I’m a bit surprised that this isn’t the default setting when you install Windows but I suspect that it causes few headaches for the average user.

Posted in Environment Setup, Security | Leave a comment

North American Collaboration Summit presentation and samples

Last week I was in Branson, Missouri to present at the North American Collaboration Summit, a great conference which has grown out of the strong community that exists because of the SharePoint Saturday movement.

I talked about building chat bots, some of the considerations around making your bots not suck and gave a couple of demos at opposing ends of the spectrum, at the simple end I showed using QnA Maker to make an FAQ bot while at the complex end I demoed the ability to authenticate with BotAuth, integrate with Azure Functions, and the Microsoft Graph.

I’ve put the base code for both the Bot and the supporting Azure Functions up on GitHub for you to look at. I’m going to keep iterating on this code and making it suck less.

Posted in Uncategorized | Leave a comment

Microsoft Graph Community Call Recording

The Microsoft Graph team are awesome. Not only are they providing the Microsoft Graph but they are also really responsive and great to work with. Now they are looking to spread their love even further with a monthly community call.

If you missed the first call on December 5th, don’t worry, the recording and slides are now available. The next call is scheduled for January 2nd 2018, so start your year right with a dose of love from the Microsoft Graph team.

Posted in Community, Development, Microsoft Graph | 2 Comments

Docker on Windows – Angular Development

I’ve been on a bit of a Docker kick lately. Mostly to help my team reduce the time it takes to get up and running on a project. The end goal here being that, where possible, we’ll have containerized development and deployment environments.

A lot of this drive has come from needing to pick up a few older projects and encountering a number of issues getting these projects up and running. Some of these projects needed older versions of node, grunt or gulp installed to work correctly. Had the development environments for these projects been properly containerized a lot of the issues encountered could have been mitigated

As we’re using Angular and @angular/cli for a few of our front-end projects I’ve started there.

There are a number of public images available on Docker Hub that can provide a containerized runtime for you toolchain. I’ll use the teracy/angular-cli image in my examples here as it’s pretty well supported, allows for running tests, and is kept up to date by it’s maintainer.

In this post I’ll walk through getting a containerized dev environment set up and a few changes that you will need to make to your Angular project to have it run well under this arrangement.

Spin up your container

First of all make a new directory on the command line, move into and spin up your container…

mkdir my-new-app
cd my-new-app
docker run -it --rm -p 4200:4200 -p 49153:49153 -v ${pwd}:/my-new-app teracy/angular-cli /bin/bash

Assuming that you don’t already have the teracy/angular-cli image already this will pull down the image and launch a new container for you. This command also mounts the directory on your host machine in which you want to store your source code in the file system of the container as /my-new-app.

Next we’ll use the @angular/cli tools to spin up an new Angular project.

Scaffold your Angular App

ng new my-new-app –-skip-install
cd my-new-app
npm install

For some reason the npm install step in ng new always fails for me, so this sequence dodges that issue. That will take a little while as it pulls down all the necessary node modules from npm. Let’s take advantage of this time to make some changes.

Make ng serve work as expected

  • Open the my-new-app using your editor of choice from the host machine.
  • Open the package.json file
  • Change the start entry in the scripts object to read
    ng serve –host 0.0.0.0 –poll 2000
    

This change binds the dev web server to listen to all requests on the default port (4200) and ensures that file changes made from the host machine are detected from the container for the purposes of automatic rebuilds.

Inside the container run up the development server by running this command:

npm start

From your host machine you can now go to http://localhost:4200 and you’ll see the skeleton app served to your browser. If you make changes to the code you’ll see a rebuild triggered when you save your changes.

All good so far. If this is all your want to do then you can even use my extremely light weight image gavinbarron/ng-cli-alpine.

Configure for running tests

However if you want to run tests then there’s still a little more to do and my image won’t meet your needs. Let’s get the tests running successfully.

Open the karma.conf.js file and add the section below after the browsers entry:

customLaunchers: { 
    Chrome_no_sandbox: {
        base: 'Chrome',
        flags: ['--no-sandbox']
    }
},

Save all your changes and run in the container (Use Ctrl + C to stop the web server if you need to):

ng test --browsers Chrome_no_sandbox

Conclusion

I’ve seen you how easy it is to get a development environment for Angular up an running in a Docker container. You could take this further with docker-compose and a .yaml file as outlined in this great post that helped me get up and running: http://blog.teracy.com/2016/09/22/how-to-develop-angular-2-applications-easily-with-docker-and-angular-cli/

Posted in Development, DevOps, Docker | 2 Comments

Docker on Windows – Network Issues

Recently after updating to version 17.0.3.0 I noticed some network related issues while attempting to install new npm packages and interact with Docker Hub.

Attempting to search on Docker Hub would reliably fail

docker search dotnet
Error response from daemon: Get https://index.docker.io/v1/search?q=dotnet&=25: dial tcp: lookup index.docker.io on 192.168.65.1:53: read udp 192.168.65.2:43594->192.168.65.1:53: i/o timeout

Turns out the fix was remarkably simple, instead of using the Automatic DNS Server switching to a fixed DNS Server resolved the issue:

docker network settings

Posted in Development, DevOps, Docker | Leave a comment

Docker on Windows – Mounting Volumes

If your using Docker on Windows and looking to share folders between your host machine and your running containers you’ll likely want to us the –v flag to mount a volume like this:

docker run –it --rm –v /d/some/folder/path:/app –w /app node /bin/bash

Luckily the error message is nice and helpful:

C:\Program Files\Docker\Docker\Resources\bin\docker.exe: Error response from daemon: C: drive is not shared. Please share it in Docker for Windows Settings. See 'C:\Program Files\Docker\Docker\Resources\bin\docker.exe run --help'.

The fix is simple:

  • Open up the system tray and find the whale, right click on it and select Settings…
  • Choose the Shared Drives tab on the left.
  • Check all of the drives that you would like to make available to Docker.
  • Then you will need to provide a username and password which Docker will then use to access files the files on the host machine, so take care here if you have funky file permissions.

So if you’re like me and using Waldek’s spfx container you can now edit the code from your host while the toolchain executes in the container.
There’s one small tip I have to you folks out there you can use ${PWD} in PowerShell to reference the directory in which you are running your command. so assuming that you are in the root folder of your spfx project it looks like this:

docker run -h spfx -it --rm --name spfx-helloworld -v ${PWD}:/usr/app/spfx -p 5432:5432 -p 4321:4321 -p 35729:35729 waldekm/spfx

Update: There’s also a more cryptic, and slightly misleading, message you might encounter if you use an account with an expiring password, like say, your domain account and you change the password…

C:\Program Files\Docker\Docker\Resources\bin\docker.exe: error during connect: 
Post http://%2F%2F.%2Fpipe%2Fdocker_engine/v1.26/containers/create?name=ng-cli-test: open //./pipe/docker_engine: 
Access is denied. In the default daemon configuration on Windows, the docker client must be run elevated to connect. 
This error may also indicate that the docker daemon is not running..
See 'C:\Program Files\Docker\Docker\Resources\bin\docker.exe run --help'.

Posted in Development, Docker, SharePoint, SPFx | 1 Comment